Strange measurement increase

As one can see here https://graphhopper.com/measurement/#graph

image

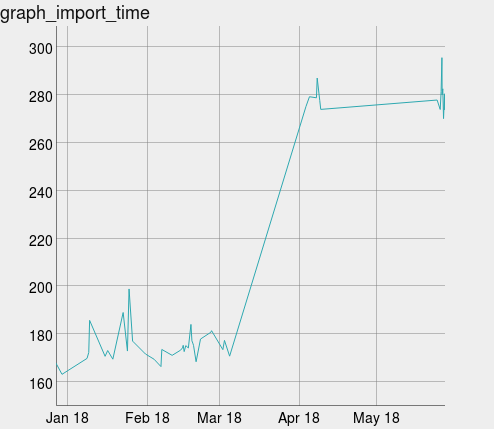
there is a huge increase somewhen in March. But when I try to find the causing commit all results seems to be within 260s and 280s.

I also tried the commit from March, where the import time was around 170s at that time and the result now was also 280s.

There was no hardware change, even a restart of the machine did not help. One guess could be an increase due to a linux software update, but the increase is so massive that it seems to be unlikely. Additionally I increased -Xmx as sometimes the reason for a slow down was a memory usage / GC issue (and the memory usage seemed to increase by 300mb), but also this did not fix the slow down.

Any other guess?

Did you change anything else like JVM, GC, etc.?

It might also be a hardware issue, for example a damaged drive that slows everything down.

The JVM might have changed but only within the jdk8 cycle. But you are right probably it is time to try some new hardware.

1 Like

There was an increase also for purely CPU based operations I guess it could be also the slow down of meltdown patches of the linux OS.

1 Like

That’s also what I suspect. It could be a problem with meltdown/spectre patches and that the import heavily benefits of specilative calculations.

Hmm this looks more like either the map or some import settings were updated:

image

1 Like