Hey guys,
I’ve been facing a problem with my GH and I’m investigating to find out the problem.
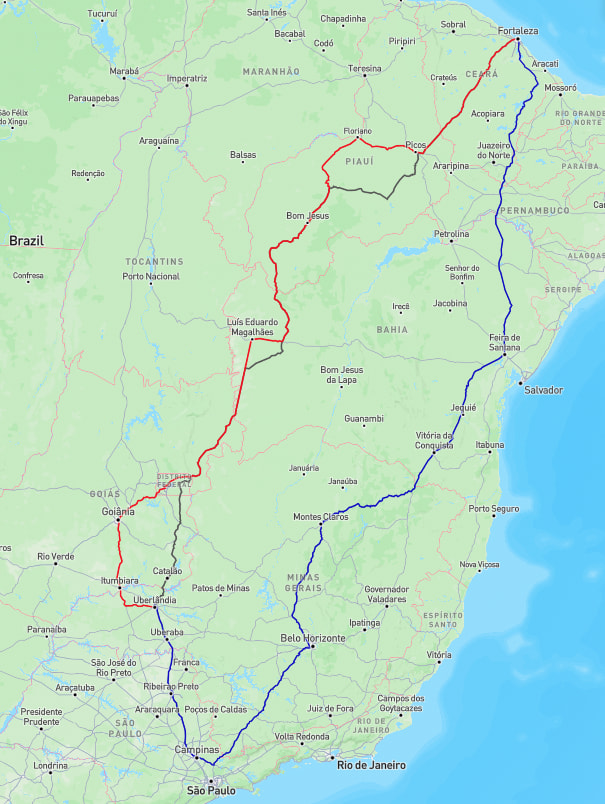
I made a certain request, in three different point of time. The first one, the red line in 2026-01-13, the second one, the blue line in 2026-02-03, and the third one, today.
I’m running my graphhopper 9.1 in my own infraestructure k8s. And this is my configuration.
config.yml
    graphhopper:
      datareader.file: ""
      datareader.worker_threads: 16
      custom_models.directory: /graphhopper/profiles
      profiles:
        - name: car
          custom_model_files: [ car.json ]
        - name: truck
          custom_model_files: [ truck.json ]
        - name: big_truck
          weighting: custom
          custom_model_files: [ big_truck.json ]
      profiles_ch:
        - profile: car
        - profile: truck
      profiles_lm:
        - profile: car
        - profile: truck
        - profile: big_truck
      prepare.min_network_size: 1000
      prepare.subnetworks.threads: 50
      prepare.ch.threads: 2
      prepare.lm.threads: 3
      routing.non_ch.max_waypoint_distance: 100_000_000 #100.000.000
      routing.max_visited_nodes: 15_000_000 #15.000.000
      import.osm.ignored_highways: footway,cycleway,path,pedestrian,steps # typically useful for motorized-only routing
      index.max_region_search: 30
      graph.location: graph-cache
      graph.dataaccess.default_type: RAM_STORE
      graph.encoded_values: country,hgv,max_weight,max_height,max_width,toll,car_access,car_average_speed,road_access,road_class
    server:
      application_connectors:
        - type: http
          port: 8989
          bind_host: localhost
          max_request_header_size: 50k
      request_log:
        appenders: []
      admin_connectors:
        - type: http
          port: 8990
          bind_host: localhost
    logging:
      appenders:
        - type: file
          time_zone: UTC
          current_log_filename: logs/graphhopper.log
          log_format: "%d{yyyy-MM-dd HH:mm:ss.SSS} [%thread] %-5level %logger{36} - %msg%n"
          archive: true
          archived_log_filename_pattern: ./logs/graphhopper-%d.log.gz
          archived_file_count: 30
          never_block: true
        - type: console
          time_zone: UTC
          log_format: "%d{yyyy-MM-dd HH:mm:ss.SSS} [%thread] %-5level %logger{36} - %msg%n"
      loggers:
        "com.graphhopper.osm_warnings":
          level: DEBUG
          additive: false
          appenders:
            - type: file
              currentLogFilename: logs/osm_warnings.log
              archive: false
              logFormat: '[%level] %msg%n'
big_truck.json
    {
      "priority": [
        {
          "if": "car_access == false || hgv == NO || road_access == PRIVATE",
          "multiply_by": "0"
        },
        {
          "if": "max_width < 3 || max_height < 4 || max_weight < 18",
          "multiply_by": "0"
        },
        {
          "if": "road_class != MOTORWAY",
          "multiply_by": "0.2"
        },
        {
          "if": "road_class == TERTIARY || road_class == RESIDENTIAL",
          "multiply_by": "0.4"
        },
        {
          "if": "road_class == PRIMARY",
          "multiply_by": "0.5"
        },
        {
          "if": "road_class == TRUNK",
          "multiply_by": "0.6"
        },
        {
          "else": "",
          "multiply_by": "0.5"
        }
      ],
      "speed": [
        {
          "if": "true",
          "limit_to": "car_average_speed*0.9"
        },
        {
          "if": "max_height < 4.5",
          "multiply_by": "0.5"
        },
        {
          "if": "max_weight < 40",
          "multiply_by": "0.5"
        }
      ]
    }
The profiles car and truck are exactly the same available in official github repo.
I’ve checked my infra, and no changes was applied in my configuration, or, in any profile. The request are exactly the same.
I’d like to ask, what may cause this big difference in route responses. Mainly between red and blue lines?